1. Introduction
In the previous blogs, we explored strategies to enhance the efficiency of LLM training on extensive GPU clusters. Key challenges we identified includes memory usage, compute efficiency, and communication overhead. To address these, we discussed various parallelism techniques—such as data, tensor, pipeline, and context parallelism—to ensure optimal GPU utilization in bigger GPU clusters. We also examined methods like gradient accumulation and activation checkpointing to manage memory constraints. We explored the benefits of mixed-precision training, which leverages lower-precision computations to boost GPU performance while conserving memory. These insights provide a foundation for optimizing LLM training workflows across diverse GPU infrastructures.
Building on those ideas, this post discusses frameworks, profiling methods, identifying GPU bottlenecks, and effective data preprocessing strategies to enhance LLM training workflows. We are going to start with discussing the common GPU bottlenecks and how to overcome them. After this, we are going to discuss the use of profiling to identify these bottlenecks. Then, we are going to discuss frameworks for large scale LLM training that implement some of these techniques. Finally, we are going to look at important data preprocessing techniques for LLM training and Finetuning.
2. Bottlenecks
A bottleneck in AI workloads is anything that significantly limits performance, which makes training or inference slower than expected. Common bottlenecks typically involve GPU utilization, memory usage, CPU workload, or communication overhead between GPUs. Addressing these bottlenecks often yields substantial performance gains. These performance gains are usually greater than any small code optimizations that one can implement.
In LLM training scenarios, bottlenecks generally fall into three categories:
- Compute bottlenecks: These occur when GPU compute resources are not fully utilized, usually due to inefficient GPU kernels, suboptimal numerical precision, or batch sizes that are too small. Symptoms include low GPU utilization, which leads to slow training despite having powerful hardware. Techniques to overcome compute bottlenecks include optimizing GPU kernels, increasing batch size and using mixed-precision training (e.g., FP16 or BF16).
- Memory bottlenecks: Memory bottlenecks arise when GPU memory becomes the limiting factor, preventing larger batch sizes or models from fitting into GPU memory. Symptoms include out-of-memory errors or significantly reduced batch sizes. Commonly used solutions include gradient accumulation, activation checkpointing, lower precision training, and tensor parallelism to distribute memory load across multiple GPUs. Further techniques also include parameter efficient finetuning such as LoRA and QLoRA.
- Communication bottlenecks: Communication bottlenecks occur when GPUs or nodes spend excessive time idle due to inefficient data transfers, synchronization waits, or poorly optimized collective operations. Symptoms include frequent GPU idle times, increased synchronization overhead, and poor scaling as the number of GPUs grows. Communication bottlenecks can occur during many of the parallelism techniques, as these techniques are used to improve compute and memory bottlenecks, but in turn it induces overhead in the form of communication. It is important to handle this as efficiently and asynchronously as possible.
Each of these bottlenecks interact with each other in some way. For example, increasing the batch size to resolve a compute bottleneck might create a memory bottleneck. Therefore, carefully balancing these trade-offs through profiling and iterative experimentation is key. There is no free lunch.
| Bottleneck | How it was Overcome |
|---|---|
| Compute Bottleneck | - Tensor Parallelism (split computations across GPUs) - Mixed-Precision Training (FP16/BFloat16 arithmetic) - Optimize GPU kernels - Increase batch sizes |
| Memory Bottleneck | - Gradient Accumulation (simulate larger batch sizes) - Activation Checkpointing (reduce memory usage) - Lower Precision Training - Parameter-efficient fine-tuning (LoRA, QLoRA) - Tensor Parallelism (spread memory across GPUs) |
| Communication Bottleneck | - Pipeline Parallelism - Overlap Communication with Computation (asynchronous ops) |
The following sections will further explore profiling tools and existing frameworks, providing practical guidance on how to detect, analyze, and address each of these bottlenecks effectively.
3. Profiling
3.1 How it works
In the previous section, we discussed the types of bottlenecks—compute, communication, and memory—that frequently slow down large-scale AI training. Identifying these bottlenecks accurately is the crucial first step toward resolving them. This is where profiling becomes invaluable.
Profiling allows you to gain insights into your model’s runtime performance, GPU utilization, memory management, and communication efficiency. There are two main aspects of profiling:
- Speed Profiling: Speed profiling helps you understand how efficiently your model uses GPU compute resources. The PyTorch profiler is the official, accessible tool designed to analyze model performance. It provides a detailed breakdown of CPU versus GPU execution time, helping you pinpoint inefficient GPU kernels or operations causing slowdowns.
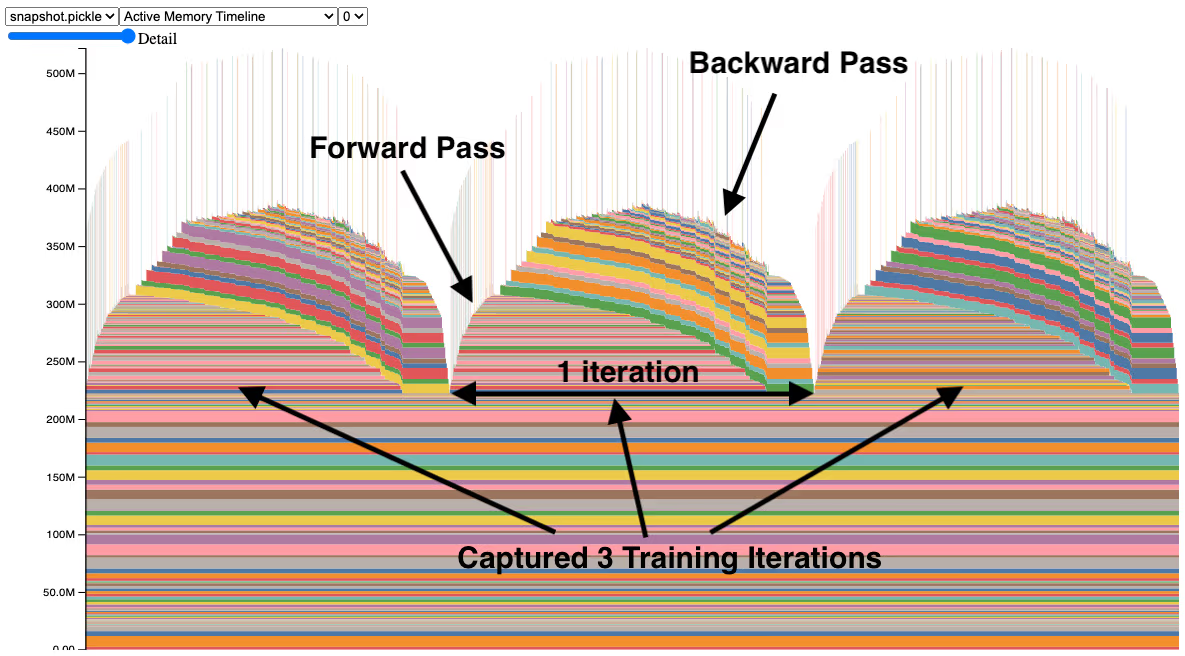
- Memory Profiling: Memory profiling targets GPU memory usage—often critical in resolving memory bottlenecks. Tools like PyTorch’s Memory Snapshot offer comprehensive guides for visualizing memory allocations, frees, and Out-of-Memory (OOM) events. Memory snapshot tools are particularly valuable because they visualize exactly when memory spikes occur during training iterations. This provides insights into how operations like the forward and backward passes affect GPU memory usage.
Below is an example of a memory profile captured during training iterations:

In this visualization, you can see memory usage across three training iterations, detailing GPU allocations during forward and backward passes. Such fine-grained information helps to debug memory-related issues, such as identifying exactly when and why OOM errors occur. For example in the picture you can see that the gpu uses less memory during the forward pass than it does during the backwards pass. This can help diagnose the issue of why you are running out of memory.
3.2 Practical example
PyTorch’s built-in profiler provides a practical way to trace and visualize exactly what’s happening on both the CPU and GPU during training. Its integration with PyTorch makes setup straightforward,. This enables you to quickly start analyzing your model performance without complicated setups.
Here’s how you’d typically set up the PyTorch profiler in your training code:
import torch

with torch.profiler.profile(
    activities=[
        torch.profiler.ProfilerActivity.CPU,
        torch.profiler.ProfilerActivity.CUDA,
    ],
    schedule=torch.profiler.schedule(wait=1, warmup=1, active=3),
    on_trace_ready=torch.profiler.tensorboard_trace_handler('./log/profile'),
    with_stack=True
) as prof:
    for step in range(steps):
        train_step()
        prof.step()
The profiler uses a schedule with:
- wait=1: Wait for 1 iteration before profiling.
- warmup=1: Run 1 warm-up iteration.
- active=3: Actively profile the next 3 iterations.
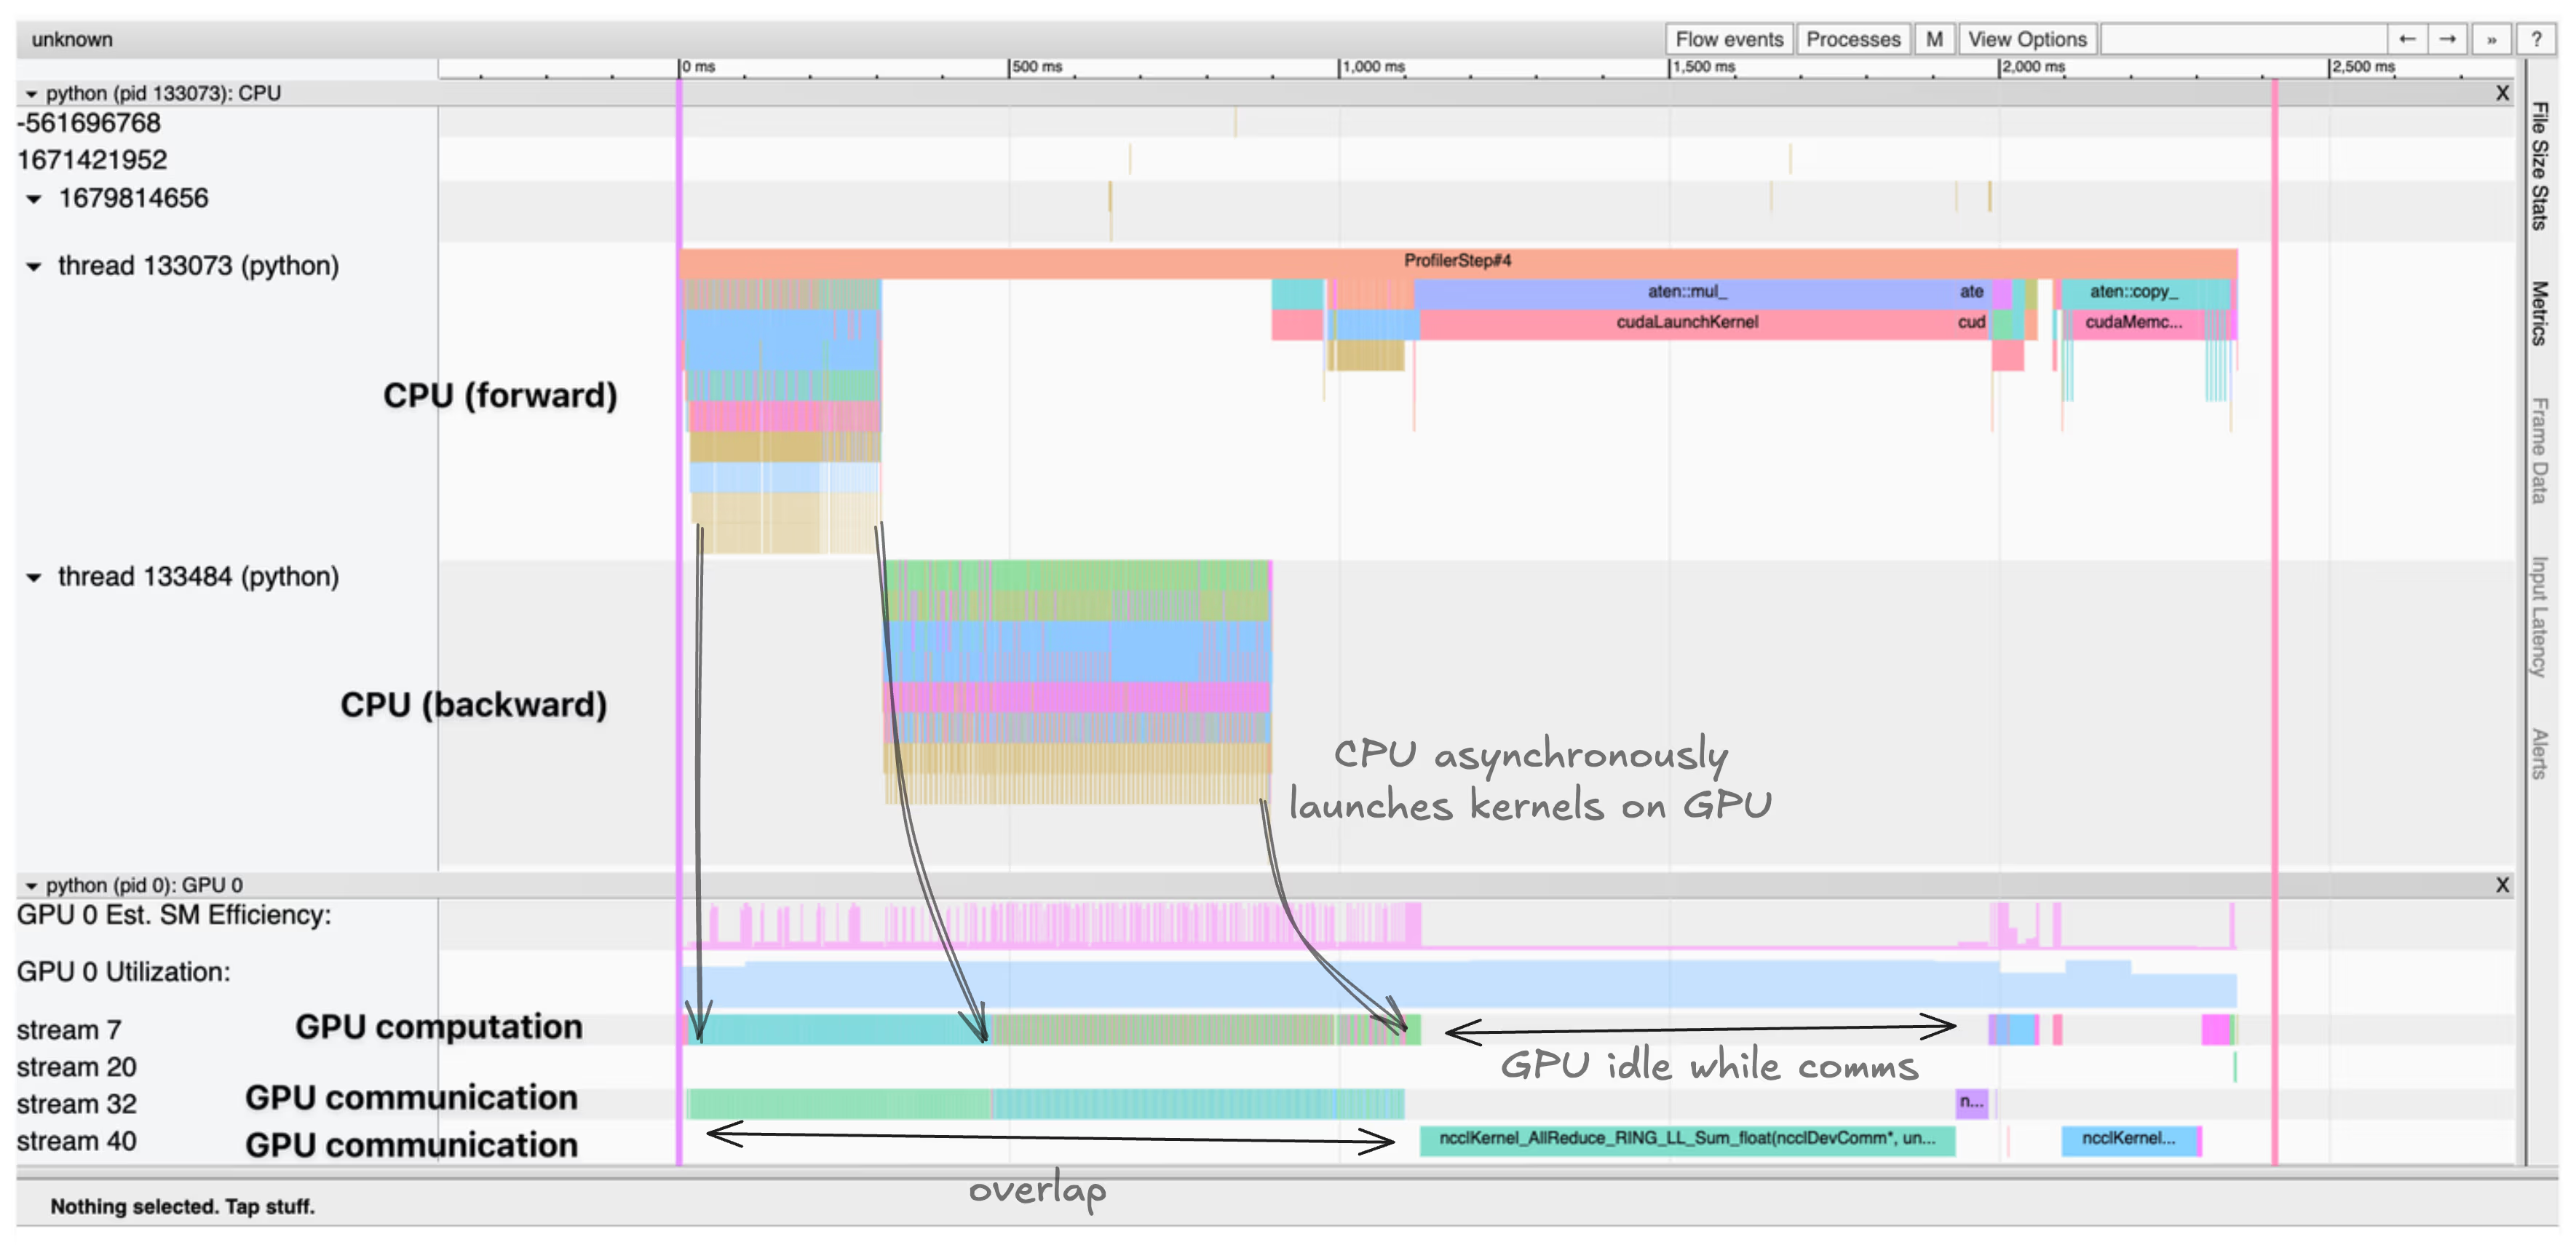
This produces an output similar to the trace shown below:

Analyzing this trace provides insights into the following bottlenecks:
- Sequential compute and communication: In the visualization, you may observe GPU computation (kernel execution) and communication (data transfers) occurring sequentially. Ideally, you’d want these activities overlapped to reduce idle GPU times and maximize throughput.
- GPU idle time: Periods where GPU streams are idle often indicate waiting for data from CPU or other GPUs. This is an indication of inefficient data loading or poor synchronization across GPUs.
- Memory movements: Frequent data transfers between CPU and GPU are visible in the trace. Excessive transfers usually indicate poorly optimized data handling or insufficient caching on GPU memory.
- Kernel launch overhead: The trace shows CPU threads asynchronously launching GPU kernels. If you see large gaps between kernel launches, the overhead of these operations might be contributing to GPU under-utilization.
Careful profiling with such detailed traces helps you clearly identify and prioritize which bottlenecks—compute, memory, or communication—you need to resolve to significantly optimize your distributed training performance.
4. Frameworks
We just identified common performance bottlenecks and discussed how profiling tools reveal these issues clearly. Now, let’s see how these insights translate into practice through deep learning frameworks. The following picture illustrates an ideal framework.

4.1 Standard vs Higher-Level Frameworks
Common deep learning libraries include PyTorch, TensorFlow, and JAX. These foundational frameworks give granular control and flexibility. This allows precise tuning of performance optimizations — like batch size adjustments, precision management and gradient accumulation.
Higher-level frameworks, built atop these standard libraries, abstract much of this complexity away. Examples include Hugging Face Trainer and PyTorch Lightning. These frameworks significantly simplify setup, accelerate prototyping, and streamline experimentation. However, they trade some flexibility for convenience. You gain speed in iteration but lose fine-grained control to deeply optimize GPU memory or compute utilization.
4.2 Specialized Large-Scale Training Frameworks
When scaling up your training to LLMs, specialized frameworks effectively implement the GPU and memory optimization techniques we’ve discussed. Here are a few leading examples:
- Nanotron (Huggingface): Nanotron is designed specifically for LLM pretraining. It implements clear APIs for common parallelism strategies (data, tensor, pipeline parallelism) and specialized optimizations like expert parallelism, parameter sharding (ZeRO-1), and parameter tying. It’s optimized for speed, flexibility, and ease of integration with custom datasets and architectures, like Mamba and MoE.
- Megatron-LM (Nvidia): Megatron-LM offers GPU-optimized building blocks specifically designed for efficient LLM training. Leveraging the Megatron-Core library, it implements intra-layer model parallelism, which scales linearly with GPU count. Advanced features include activation checkpointing, distributed checkpointing, and extensive parallelization strategies. It therefore provides robust support for large-scale training from preprocessing to downstream evaluation.
- DeepSeed (Microsoft): DeepSpeed provides a lightweight yet powerful wrapper around PyTorch. This allows state-of-the-art GPU optimizations and memory management strategies. Some of these strategies include full 3D parallelism (data, tensor, pipeline). It seamlessly integrates with Megatron and other libraries (Transformers, Accelerate, Lightning). It therefore providing a unified environment to scale your training.
- FairScale (PyTorch extension): FairScale enhances PyTorch with advanced scalability techniques, which offers implementations of state-of-the-art parallelization and optimization methods. It is a valuable tool when extending PyTorch’s native capabilities, especially when training large models.
4.3 Practical recommendations
- Experimentation: For quick prototyping and initial experiments, higher-level frameworks like Hugging Face Trainer or PyTorch Lightning provide faster iteration, intuitive APIs, and quick profiling insights into CPU and GPU times.
- Large-Scale and Optimized Training: To fully leverage GPU optimization techniques, consider specialized frameworks such as Megatron-LM, DeepSpeed, or Nanotron. These provide fine-grained control, advanced parallelism techniques, and optimized memory usage specifically designed for scaling large language models effectively.
5. Data preprocessing
5.1 Importance
We have discussed various GPU optimization techniques, frameworks, and profiling tools—but none of these optimizations matter without quality data. Data preprocessing directly impacts the effectiveness, efficiency, and final performance of LLMs. Poorly processed data leads to wasted compute, higher training costs, and lower model quality.
Effective preprocessing ensures that the computational resources you’ve optimized are not wasted. It includes filtering irrelevant information, removing duplicate or low-quality data, tokenization, normalization, and formatting your data correctly to suit the LLM you are training. Effective preprocessing leads into faster convergence, lower training times, and a higher-quality final model.

5.2 Strategy
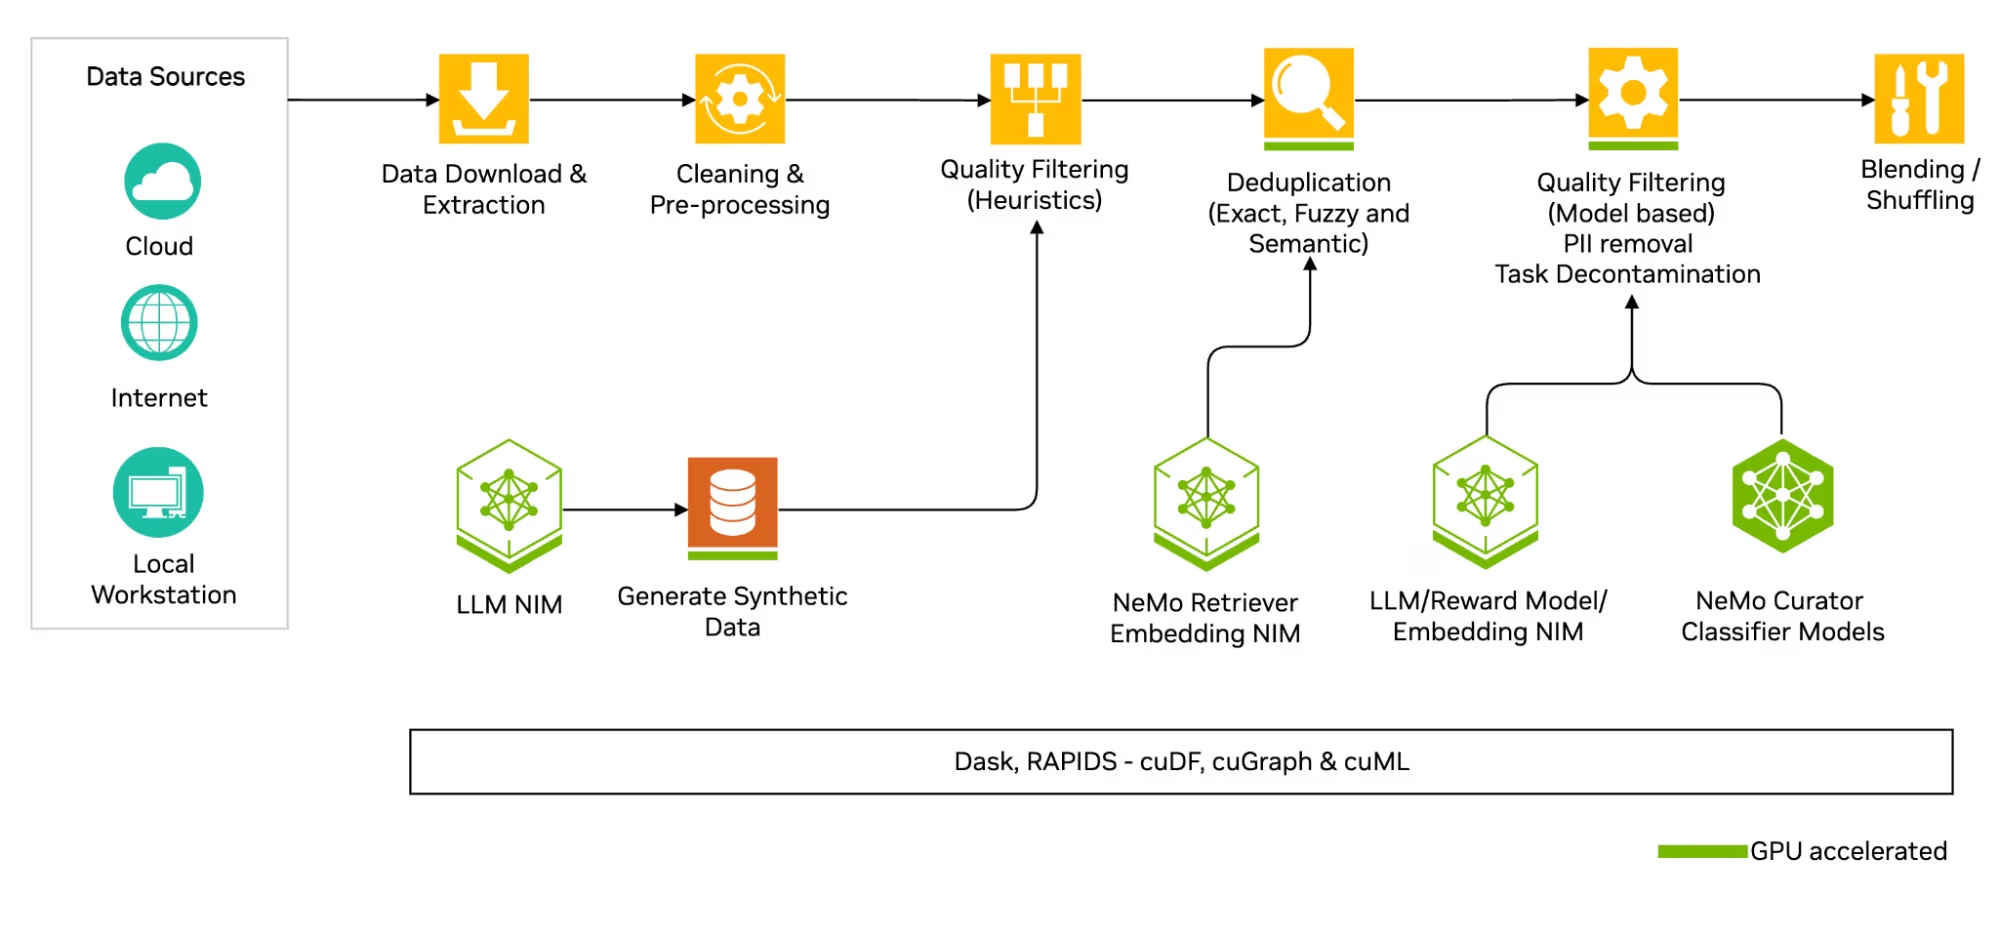
To effectively leverage GPUs and distributed training frameworks, your data pipeline should be robust . The following diagram illustrates a comprehensive pipeline commonly used in training LLMs

- Download and Extract Data: Data is sourced from various locations such as cloud storage, the internet, or local files.
- Preliminary Cleaning (Heuristic Filtering): Basic filtering based on heuristics, such as removing boilerplate strings or filtering documents by word count.
- Deduplication: Remove duplicate content through exact, fuzzy, and semantic deduplication methods. Tools like NeMo Retriever embeddings help identify redundant or semantically similar texts.
- Model-based Quality Filtering: More sophisticated filtering is done using machine learning models. This includes N-gram and BERT-based filtering, LLMs and Reward models for quality scoring and PII (Personally Identifiable Information) removal
- Blending and Shuffling: Finally, datasets are blended and shuffled to ensure data diversity, minimize biases, and improve training stability.
5.3 Synthetic Data Generation
Due to the inherent scarcity of high-quality data, synthetic data generation becomes crucial. A practical process involves:
- Generating synthetic data using LLMs
- Critiquing the generated samples for quality
- Filtering to retain only high-quality, realistic data
In this process it is important to follow best practices for ensuring high quality training data. This includes systematic approaches to identify and mitigate biases, thorough validation of sources, and consistent monitoring of model performance over time. Reducing unintended biases in training data. to mitigate biases in the model.
5.4 Finetuning
Training large language models from scratch is computationally intensive and expensive. Fine-tuning, however, offers a practical, efficient alternative. Rather than retraining an entire model, fine-tuning adjusts a pretrained model on specific downstream data. You can use this downstream data and slightly adjust the model. In contrast to training LLM, the finetuning data is usually task-specific. For example, in a sentiment analysis you would use the pretrained LLM (which was trained on a large variety of data) and then finetune it using labelled training data. The training data in this case would then be paragraphs, which are either labelled as positive, negative or neutral sentiment. This would allow the model to perform better for the task at hand.
With fine-tuning, the model leverages pre-existing knowledge (learned from diverse, large-scale datasets) and quickly adapts to your specialized use case. You can either fine-tune all model weights or freeze most layers and only update the final layers. Freezing layers drastically reduces computational costs while still delivering strong performance improvements on targeted tasks.
6. Conclusion
In this post, we’ve explored how to effectively scale up LLM training workflows. We began by identifying common bottlenecks—compute, communication, and memory—and discussed profiling techniques to precisely detect and resolve these limitations. Next, we examined deep learning frameworks like Nanotron, Megatron-LM, and DeepSpeed, highlighting how each implements advanced GPU optimizations and parallelism strategies.
We then emphasized the foundational role of data preprocessing. This covered steps like data extraction, cleaning, deduplication, and sophisticated quality filtering techniques. Remember, optimizing GPU utilization and training efficiency starts from well-prepared data and informed profiling—laying a solid foundation before even touching the model itself.
