Beyond Average Revenue: A Four-Part Decomposition for Measuring Discovery Experiments
Why We're Publishing the Method, Not Just the Result
The e-commerce personalisation industry has a transparency problem. Vendors publish uplift numbers - "+62% conversion!", "+150% sales contribution!" - but almost never disclose how those numbers were obtained (Algolia, 2025a, 2025b). No study design. No confidence intervals. No discussion of what didn't work. And critically, no disclosure of the denominator: a "+150% sales contribution from search" is not a platform GMV uplift - it is the contribution attributed to the fraction of users who happened to touch the search bar. This makes it impossible for a data-literate buyer to assess whether a claimed effect is real, inflated by methodological shortcuts, or simply noise misinterpreted as signal.
Our forensic audit of case studies from major search and recommendation SaaS providers - Algolia, Bloomreach, Coveo, Constructor.io, Nosto - found a consistent pattern: the engineering teams operate with sophisticated causal inference tooling (Bayesian A/B testing, CausalImpact time-series models, inverse propensity weighting), but the marketing collateral strips all of this context away, presenting point estimates as absolute truth (Algolia, 2025a, 2025b; Brodersen et al., 2015). When a vendor claims "doubling global sales," are they reporting a causal treatment effect from a randomised controlled trial, or a pre-post correlation vulnerable to seasonality, latency improvements, and concurrent site redesigns?
We think this is bad for everyone. It erodes trust, rewards sloppy measurement, and makes it harder for genuinely effective products to differentiate on evidence. So we're doing something different: publishing a complete case study showing the exact experiment design, statistical model, results with confidence intervals, validation checks, and limitations.
The Partner & The Problem
MyRunway is one of South Africa's leading online fashion retailers. While they built their reputation on a members-only flash-sale model, they've since transitioned to a massive, always-on discount catalogue. Scaling to over 500 designer brands transformed their core engineering challenge: connecting shoppers to the right items when the catalogue outgrows manual curation.
In the off-price space, ingesting inventory from hundreds of full-price retailers means inheriting hundreds of conflicting taxonomies. The metadata is messy, inconsistent, and often missing. A legacy search engine relying on plain text matching breaks down when a "crimson blouse" from one label needs to rank alongside a "ruby top" from another.
At the same time, rapid user growth means a high percentage of sessions belong to new shoppers with zero click history. Traditional discovery relies on collaborative filtering — waiting for users to interact with items to figure out what to recommend. But with an ever-growing catalogue where items frequently stock out, you cannot wait weeks to collect behavioral data. By the time a legacy engine gathers enough signal to rank a new arrival, it is often already sold out.
MyRunway didn't need another vendor trying to patch broken metadata with manual synonyms. They needed zero-shot discovery: an engine that bypasses the tags entirely, "seeing" the garments the second they arrive, and ranking them instantly for brand-new users from their very first click.
The Features
To solve these dual challenges of noisy metadata and cold-start traffic, we deployed two of our core zero-shot discovery capabilities into the MyRunway experience to test their impact on purchasing behavior: Browse and Search.
Browse
Browse is Solenya's personalised listing module applied to category and collection pages - the surfaces visitors land on when they're browsing rather than searching. A conventional listing page sorts by recency or a hand-tuned popularity score, identical for every visitor. Browse replaces that with a real-time personalised ranking generated per visitor with no cold-start delay: new and anonymous users receive meaningful recommendations immediately, no prior purchase history required. Rankings stay coherent as users narrow by size, colour, or category and scroll through pages.
To make this concrete: the two clips below show the same MyRunway category page under Browse for two distinct style personas. Elle Woods (from Legally Blonde) opens the page and sees a front row of bright, bold occasion wear - the kind of thing you'd pack for a long weekend.
Wednesday Adams opens the same URL at the same moment and sees something else entirely: structured blacks, clean lines, minimal colour. Same catalogue. Same session start. Completely different ranking - generated in real time from signals built without a single prior purchase.
Search
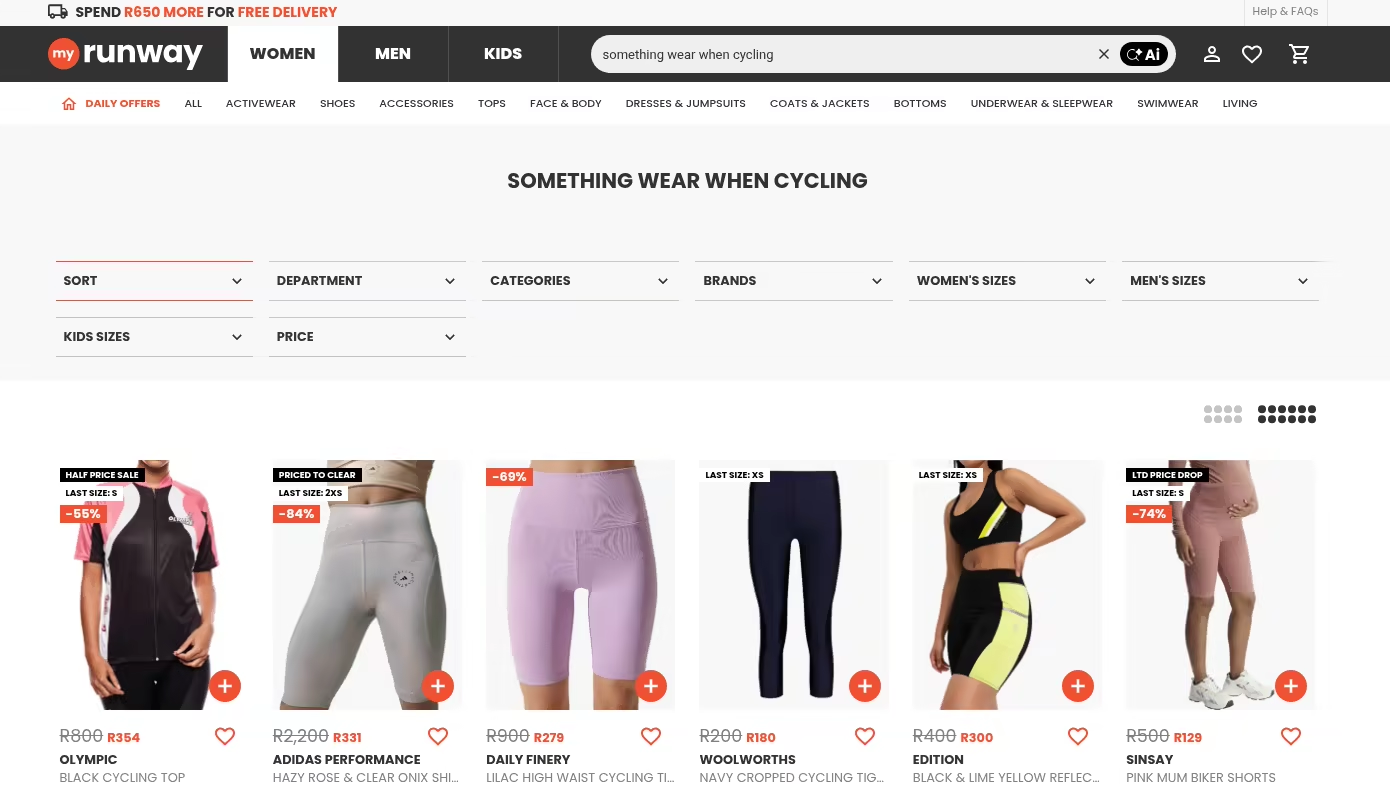
Search is Solenya's multimodal semantic search API. It understands intent across three input modes - text, image, or both at once - which is what the "multimodal" means in practice.
The first screenshot shows a pure text query: "something to wear when cycling." No product in the MyRunway catalogue is literally titled that. A keyword index returns nothing useful. Semantic search maps the query to intent - activewear, practical, probably lycra - and surfaces exactly what the shopper had in mind.
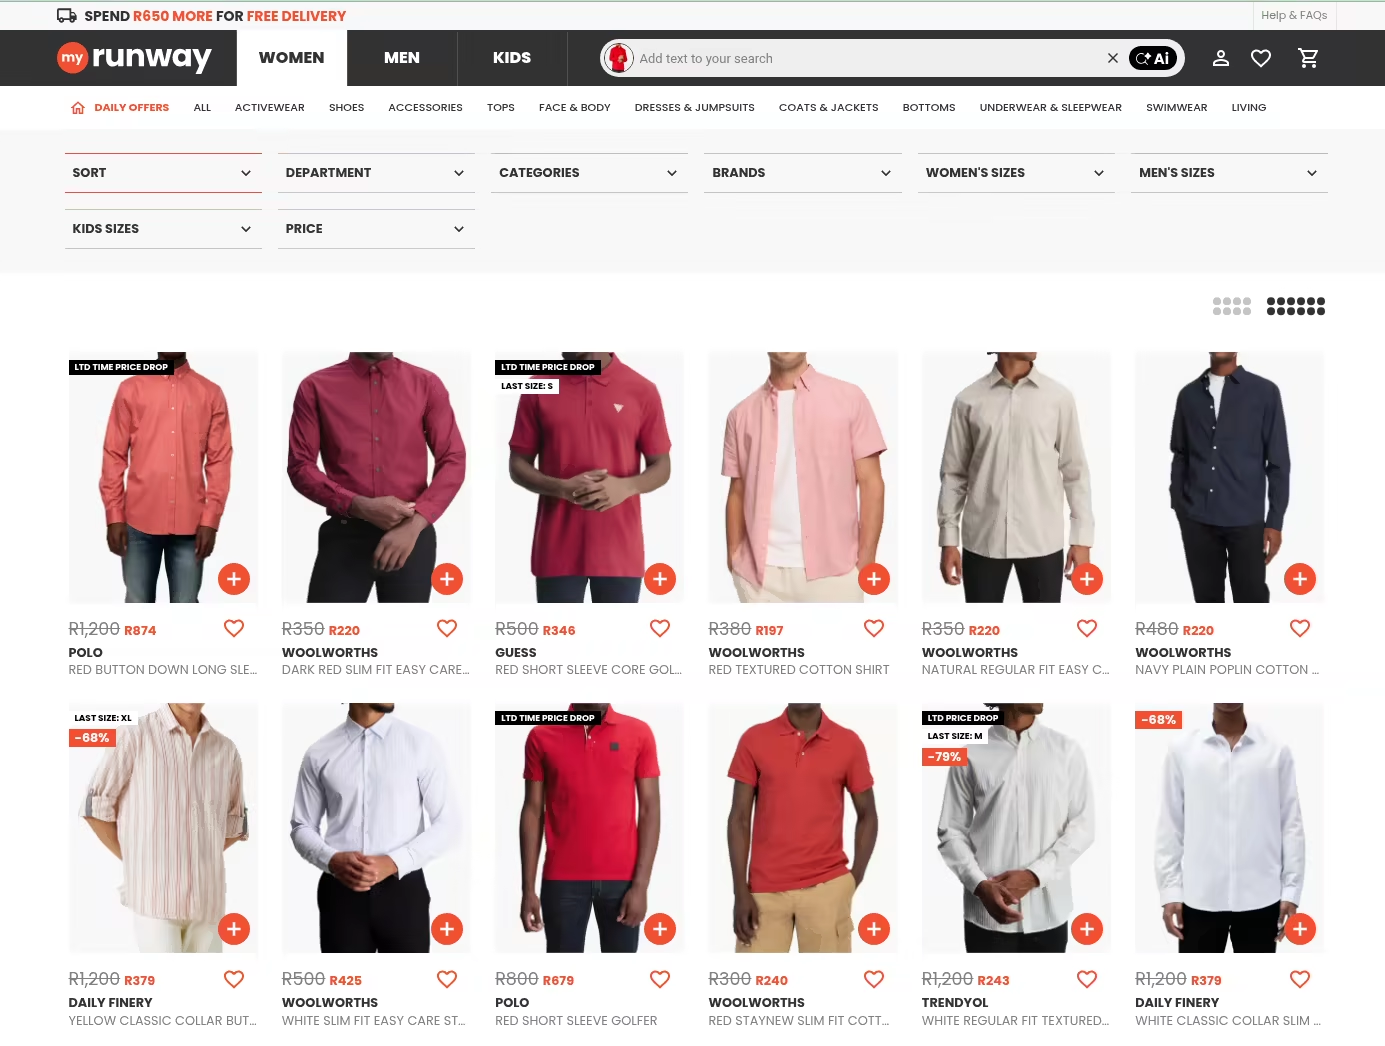
The second shows reverse image search: a shopper uploads a photo of a red shirt - maybe something they saw on a friend, or a screenshot from a magazine - and retrieves the visually closest items in stock, no words required. The model reads shape, cut, neckline, and fabric weight from the image directly.
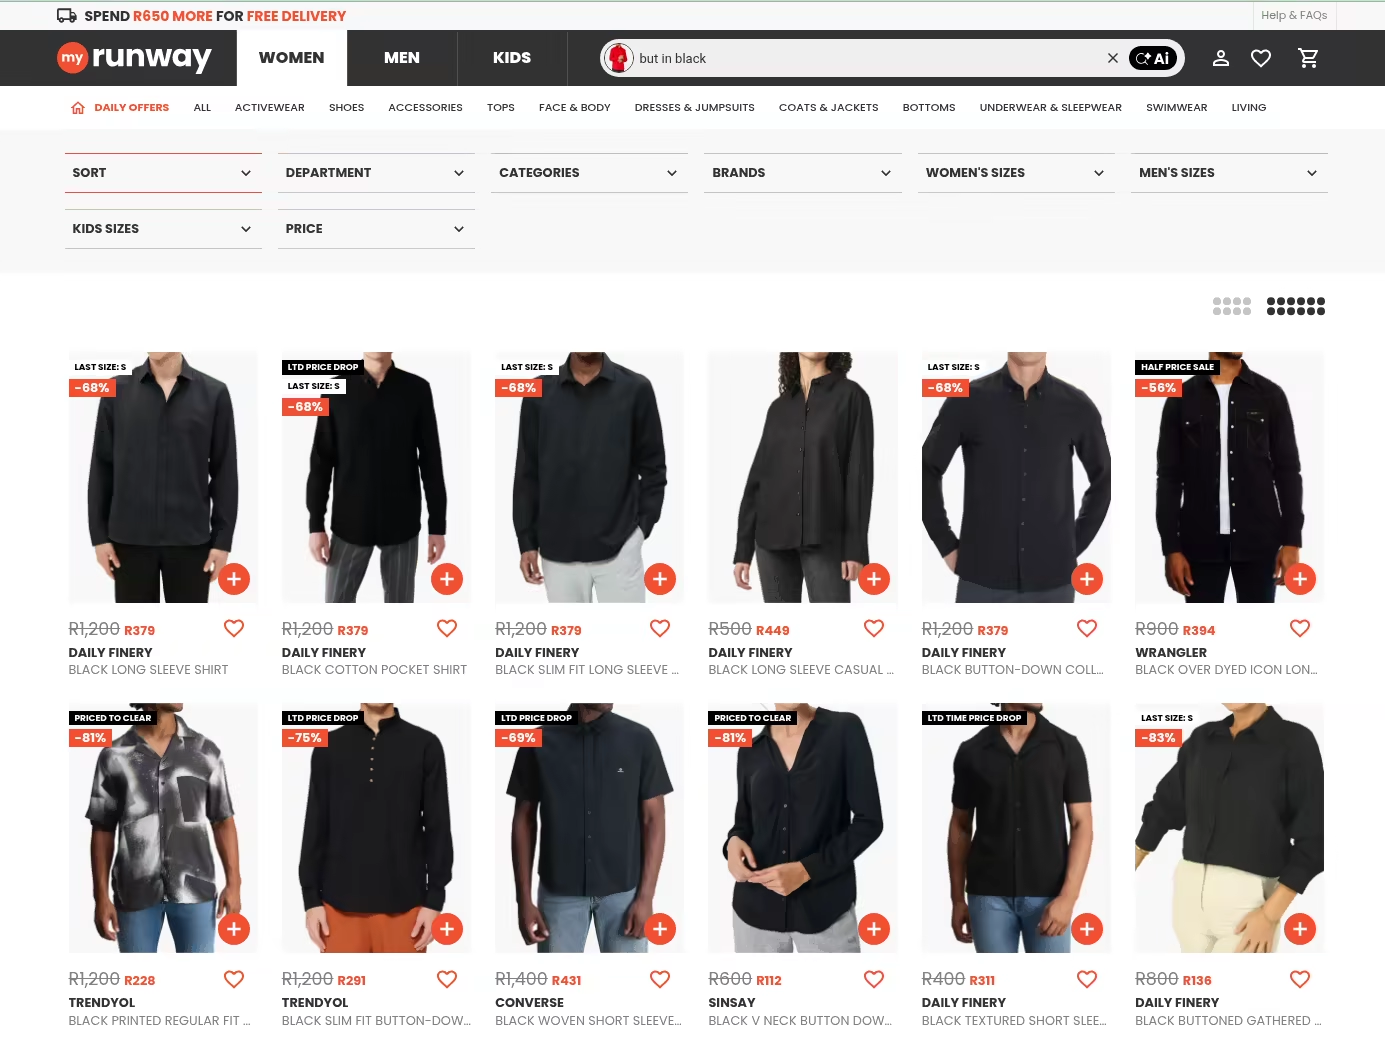
The third is where it gets interesting: composed search. The same red shirt image is uploaded, but this time paired with a short text refinement - "but in black." The results shift the colourway while preserving everything else about the garment: the silhouette, the cut, the collar. Image and text are fused into a single query. This is not a filter applied after the fact; the colour shift happens inside the retrieval itself.
The Experiment
Design
We ran a factorial experiment (Kohavi et al., 2009) testing two Solenya features simultaneously, capturing nearly one million sessions across both mobile app and desktop web on MyRunway. Each user session was independently assigned to treatment or control for each feature - except for a concurrent UX experiment that introduced a design complication we'll address below.
The control condition in both cases is MyRunway's existing production stack: Browse control is a static listing page ranked by a hand-tuned popularity score; Search control is an AWS-managed OpenSearch service running BM25 keyword matching. In other words, Solenya's personalised Browse and multimodal semantic Search are being measured against a live, actively maintained commercial baseline - not a strawman.
The UX Experiment Complication
A concurrent UX redesign experiment ran alongside our feature tests, creating a non-standard allocation:
This means 10% of users were forced into all Solenya features simultaneously, creating correlation between feature assignments in that subgroup. Naive per-feature comparisons would therefore double-count uplift - each feature's marginal estimate would absorb the effect of all co-deployed features. This is a textbook example of Omitted Variable Bias (OVB), and it's precisely the kind of confound that pre-post analyses and simple A/B dashboards fail to detect. We address this with multivariate regression, which decomposes the confounded estimate into individual feature contributions.
Pre-Estimation Diagnostics
Before fitting any models, we ran standard diagnostic checks to ensure valid inference:
- Sample Ratio Mismatch (SRM): The observed imbalance in treatment groups was confirmed as by design (the UX experiment's forced allocation), not a data pipeline error.
- User-Level Clustering: All standard errors are clustered at the user level to avoid pseudo-replication - a common pitfall where session-level analyses inflate apparent statistical significance by treating repeat visits from the same user as independent observations.
- Multicollinearity (VIF): Variance Inflation Factors confirmed no problematic collinearity in the design matrix.
- Influential Observations: Cook's Distance analysis confirmed no single observation unduly influenced the estimates.
The 4-Part Revenue Decomposition
Why Not Just Compare Average Revenue?
The most common approach to A/B test analysis - comparing mean revenue between treatment and control - has a fundamental flaw for e-commerce: it forces a single model to handle both the many users who spend nothing and the few who spend variable amounts. This conflates two distinct questions - did the user buy? and how much did they spend? - producing noisy estimates with unnecessarily wide confidence intervals.
This isn't just a theoretical concern. It's the same problem that undermines most published case studies: testing a dozen correlated metrics (user conversion rate, session conversion rate, ARPU, gross profit per user) that all capture overlapping signal, without adjustment for multiple comparisons. The more metrics you test, the more likely you are to find one that's "significant" by chance.
Instead, we decompose expected per-user revenue into four sequential, multiplicative components:
Each component is estimated with a statistical model appropriate to its data type:
- Retention (did they come back?): Logistic regression
- Frequency (how many sessions?): Shifted Negative Binomial regression, accounting for overdispersion in count data
- Conversion (did they buy in a given session?): Logistic regression
- AOV (how much per purchase?): Gamma GLM with log-link, appropriate for positive continuous data
This decomposition is closely related to the BG/NBD framework (Fader et al., 2005) widely used in customer lifetime value modelling. Because these components multiply, small percentage changes are approximately additive:
Model Validation
We validated this approach formally:
- Model selection: A Vuong test (Vuong, 1989) rejected the null hypothesis that a standard OLS model fits equally well (), confirming the 4-Part decomposition provides a statistically superior fit - particularly because it handles non-purchasers as a structural zero rather than forcing them into a revenue distribution.
- Distribution selection: For each component, we compared multiple candidate distributions - including compound, hurdle, and zero-inflated specifications - using Akaike Information Criterion (AIC). The chosen distributions produced both the lowest AIC scores and the most interpretable models of the underlying data generating process.
- Component independence: Pearson and Spearman correlations between frequency and conversion, and between frequency and AOV among converters, were negligible (), supporting the multiplicative factorisation and enabling simple variance summation across components.
Results
The Numbers
The table below presents the uplift for Browse and Search - the two features with statistically significant effects - along with the combined estimate across all tested features. Bold indicates statistical significance. Brackets show 90% confidence intervals (5th–95th percentile bounds).
| Feature | Retention (Did they return?) | Frequency (More sessions?) | Conversion (Did they buy?) | AOV (Basket size?) | Total Revenue Uplift |
|---|---|---|---|---|---|
| Browse | +3.55% [+2.3%, +4.8%] | −0.04% [−0.2%, +0.1%] | +13.51% [+8.7%, +18.6%] | −0.69% [−3.7%, +2.4%] | +16.67% [+10.5%, +23.2%] |
| Search | +4.49% [+3.3%, +5.7%] | +0.18% [+0.1%, +0.3%] | +9.94% [+5.3%, +14.8%] | −0.87% [−3.9%, +2.2%] | +14.09% [+8.0%, +20.5%] |
| Combined | +9.41% [+6.9%, +12.0%] | +0.08% [−0.2%, +0.3%] | +19.86% [+9.8%, +30.8%] | −3.12% [−8.9%, +3.0%] | +27.14% [+14.0%, +41.9%] |
What the Numbers Tell Us
Conversion is the engine. The combined +27.1% revenue uplift is driven almost entirely by a +19.9% lift in conversion rate - people who would not have purchased are now purchasing. Retention contributes a meaningful +9.4%, but frequency and basket size show no significant movement.
Browse delivers the largest single-feature effect (+16.7%), driven by a +13.5% conversion lift - roughly fourteen additional purchasers for every hundred who would not have converted under control. Retention adds another +3.6%, meaning the users Browse wins over are also more likely to return.
Search follows at +14.1%. Multimodal semantic search delivers its own +9.9% conversion lift, with the strongest retention effect of any feature (+4.5%) and the only statistically significant frequency effect (+0.18%). Users who experience better search come back more often.
Features are additive - no synergy, no interference. We tested for interaction effects between all feature pairs using F-tests and Likelihood Ratio Tests. The result was unambiguous: . The combined effect is simply the sum of individual parts. This is a clean result for deployment strategy - features can be rolled out independently without worrying about complex interdependencies.
The effect is temporally stable. We compared estimates from the main experimental period against a later verification period. Cross-period overlap tests confirmed that the treatment effects - particularly the conversion rate driver - remained stable over time, ruling out short-term novelty effects. Panel regressions with time interactions found no significant temporal variation.
How This Compares to Industry Reporting
The contrast with typical vendor case studies is instructive. Consider the widely cited Lacoste–Algolia case study, which reports a "+62% mobile conversion uplift" and "+150% sales contribution from search" (Algolia, 2025c, 2025d). The documentation provides no sample size, no confidence interval, no description of the assignment mechanism, and no discussion of confounds.
Was it a randomised experiment or a pre-post comparison? If pre-post, how much of the uplift came from the infrastructure upgrade (migrating from an on-premise Solr instance to Algolia's edge network reduces latency, which independently improves conversion) rather than the algorithm? Were mobile and desktop effects combined or cherry-picked? Did conversion gains come at the expense of average order value? The case study provides no way to answer any of these questions.
There is also a denominator problem that rarely gets named. A "+150% sales contribution from search" sounds like a platform-wide result, but it almost certainly is not. It measures revenue attributed to sessions in which a user interacted with the search bar - typically a minority of all sessions on a fashion site. A retailer where 20% of sessions touch search could see a dramatic-looking "search contribution" lift while the platform-wide revenue effect is negligible. Our metric is per-user revenue across all users in the experiment - not a subgroup selected by feature engagement. That is a harder number to inflate.
This is not an isolated example. Our audit of public case studies across major vendors found a consistent pattern:
| Dimension | Typical vendor case study | This study |
|---|---|---|
| Metric | Point estimate ("62% uplift") | Point estimate + 90% confidence interval |
| Denominator | Feature-users only (e.g. sessions that touched search) | All experiment users - Intent-to-Treat |
| Method | Implied pre-post or unspecified | factorial RCT with multivariate regression |
| Sample size | Not reported | Nearly 1M sessions, clustered at user level |
| Control group | None or implicit | Randomised holdout with SRM verification |
| Confound control | Not addressed | OVB correction, VIF, Cook's Distance |
| Null results | Never reported | Reported and discussed |
| Limitations | Never reported | Dedicated section |
| Validation | Customer testimonial | Vuong test, bootstrap, independent differencing, code review |
To be fair, the engineering teams at these companies operate with real rigour - Algolia's internal A/B testing documentation describes confidence intervals, 7σ outlier trimming, and sample size estimation (Algolia, 2025a, 2025b). Coveo AI Labs publishes at SIGIR and RecSys with counterfactual evaluation and inverse propensity weighting (Coveo AI Labs, 2021; Tagliabue et al., 2020). The sophistication exists - it's just absent from the material that reaches buyers. We believe publishing the full methodology alongside the results serves both the buyer and the industry.
Validation
Extraordinary claims require extraordinary evidence. A +27% revenue uplift is a large effect, and we subjected it to multiple independent cross-checks:
-
Non-parametric bootstrap. We implemented the differencing estimator in code with bootstrap confidence intervals, providing a model-free cross-check on the parametric regression CIs. The resampled intervals are consistent with the regression analysis.
-
Internal code review. The experiment code, data pipeline, and statistical analysis were reviewed by a qualified internal team, confirming correctness of data processing, model implementation, and result interpretation.
-
Distribution selection via AIC. For each component of the 4-Part model, we compared multiple candidate distributions - including compound, hurdle, and zero-inflated specifications. The chosen distributions (Logistic, Shifted Negative Binomial, Gamma) produced both the lowest AIC scores and the most interpretable models of the underlying data generating process.
Limitations
We believe honest reporting of limitations is as important as reporting results. Here is what we cannot fully account for:
Platform split unknown. We do not have Solenya-side instrumentation to decompose effects by device type (mobile app vs. desktop web). Treatment effects may differ systematically across platforms, and we cannot currently measure this.
Exposure uncertainty. Our estimates are Intent-to-Treat (ITT): they include users who were assigned to a feature but may never have seen it. A user assigned to a feature's treatment group who never navigated to the relevant page received no actual exposure. This dilutes the estimated effect toward zero - meaning the true effect among users who actually engaged with the feature is likely larger than what we report.
The concurrent UX experiment reduced precision. The forced allocation reduced the effective sample size for isolating individual feature effects and introduced confounding that our regression adjustment corrects but cannot fully recover from. Future experiments should avoid concurrent designs that create forced correlation between treatment assignments.
Usage-uplift relationship unmodelled. We have not estimated the dose-response relationship between feature usage (e.g., number of searches performed) and uplift. We therefore cannot predict how UX changes that increase or decrease feature engagement would translate to revenue impact.
Comparison to prior estimates. Earlier analyses on this retailer reported different effect sizes due to: (1) session-level aggregation that inflated significance via pseudo-replication, (2) bundled feature deployments that made individual contributions unidentifiable, and (3) multiple comparisons across correlated metrics without family-wise error rate adjustment. Despite these methodological differences, the directional findings align: Browse and Search have consistently shown positive effects - suggesting we are measuring the same underlying signal, but more carefully.
Single retailer, single period. This is one experiment on one site. Effect sizes will vary with baseline search quality, catalogue characteristics, user demographics, and integration depth. We do not claim these numbers generalise to all e-commerce.
What Retention Means for Lifetime Value
The 4-Part decomposition maps naturally onto statistical customer lifetime value (CLTV) frameworks (Fader et al., 2005):
The key insight is the term. Retention improvements don't merely add - they are leveraged. A +9.4% relative retention gain can translate to 20–30% longer expected customer lifetimes, depending on baseline churn rates. While this experiment was too short for true churn estimation, the retention effect is consistent with meaningful long-term CLTV impact - and future work with CUPED-style variance reduction (Deng et al., 2013) using pre-experiment data could narrow these intervals further.
Closing Thoughts
This study represents a single experiment on a single retailer over a single period. It is not proof that zero-shot discovery will produce a +27% uplift for every e-commerce site.
What it does demonstrate is that rigorous measurement is both possible and valuable. The factorial design let us test multiple features simultaneously while maintaining clean causal identification. The 4-Part decomposition told us not just that revenue moved, but why - and the answer (conversion, not basket size) has direct implications for product strategy. The validation cross-checks give us confidence the effect is real, not an artefact of model specification. And the limitations section tells us exactly where to improve next.
We believe the e-commerce personalisation industry needs more of this: open methodology, published confidence intervals, honest discussion of null results, and a willingness to show the work. We hope this case study contributes to that standard.